Hypersonic Experimental Aerothermoelastic Test (HEAT)
The extreme environmental conditions experienced in hypersonic flight can cause airframe structural deformations and unsteady responses. Furthermore, the heating rates and maximum temperatures can vary significantly over the surface of a vehicle. Temperature gradients can also exist through the vehicle skin.
HEAT was an experiment to characterize the fluid-thermal-structure coupling of a test article with a curved panel segment matching full-scale radius of curvature through a series of tests at hypersonic speeds in a wind tunnel. The objective of the customer, the United States Air Force (USAF), was the generation of high-fidelity experimental data for use in validating coupled fluid-thermal-structural (FTS) computer modeling approaches of transient, but slowly-varying, aerothermoelastic effects in hypersonic flow.
This high-fidelity coupled fluid-thermal-structure (FTS) modeling combines the interactions between Computational Fluid Dynamics (CFD) modelling of the hypersonic flow and Finite Element Analysis (FEA) of both structural and thermal effects. The test article included a thin, curved panel exposed to heating and hypersonic flow.
The HEAT project was funded by the Air Force Research Laboratory (AFRL) under the Small Business Innovation Research (SBIR) Program. GAC completed the third in a series of three wind tunnel tests, for the USAF in September 2021 at the von Karman Gas Dynamics Facility (VKF) at the Arnold Engineering Development Complex (AEDC), Arnold Air Force Base, near Tullahoma, Tennessee. The VKF provides aerothermal ground test simulations of hypersonic flight over a wide range of velocities and pressure altitudes. AEDC is a ground-based flight test facility operated by the Air Force Test Center. The test was conducted at two Mach numbers and four Reynolds numbers corresponding to four equivalent altitudes.
In this work GAC leveraged the earlier development and testing by adapting the test article, originally mounted on the wall of the test section, to a design mounted on a sting in the central part of the wind tunnel test section location. This modified approach reduced the boundary layer effects and enabled more in-situ and remote sensing measurements. The test article incorporated state-of-the-art sensors for the measurement of its structural response (e.g., stresses, accelerations, deflections) as well as providing information about the surface and tunnel flow quantities relevant to the aerodynamic (e.g., surface, stagnation and near body flow pressures, and shear stress) and thermal environments (e.g., temperatures). In addition, the central wind tunnel test section location enabled three-dimensional differential image correlation (3D-DIC) of the test article and schlieren high-speed imaging of the shockwave environment near the test article.
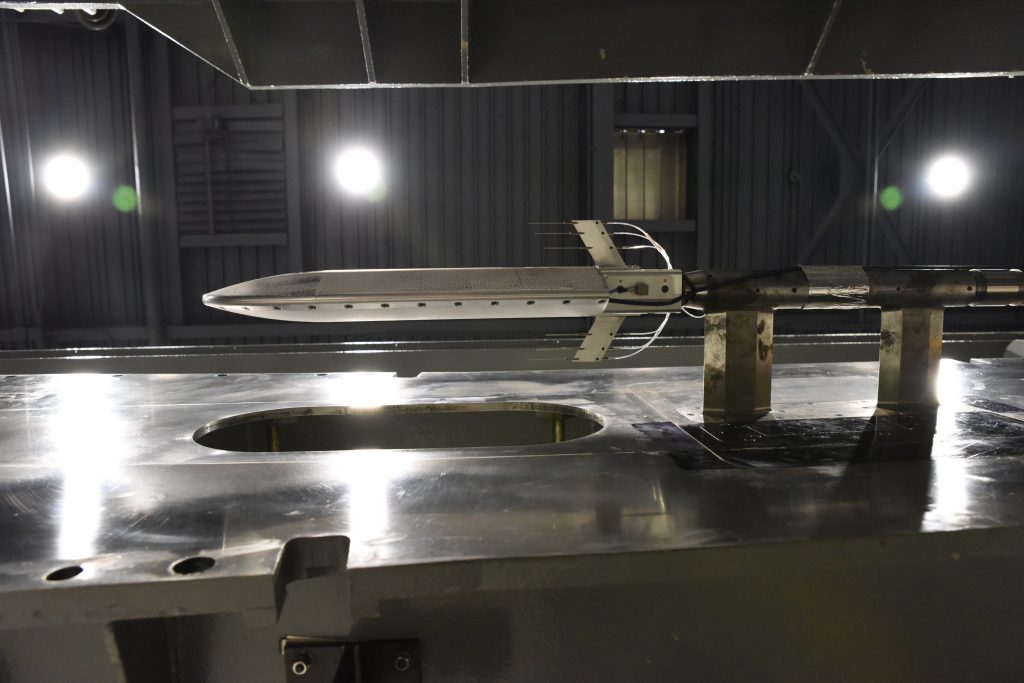
The image below is a view of the side of the test article along with its aft-mounted pitot probes, which were used to characterize flow offsets caused by test article distortion during the testing. Note in this upward looking photo, the wind tunnel wall with the mounted model is retracted from the rest of the wind tunnel, so the background is the ceiling of the tunnel bay.
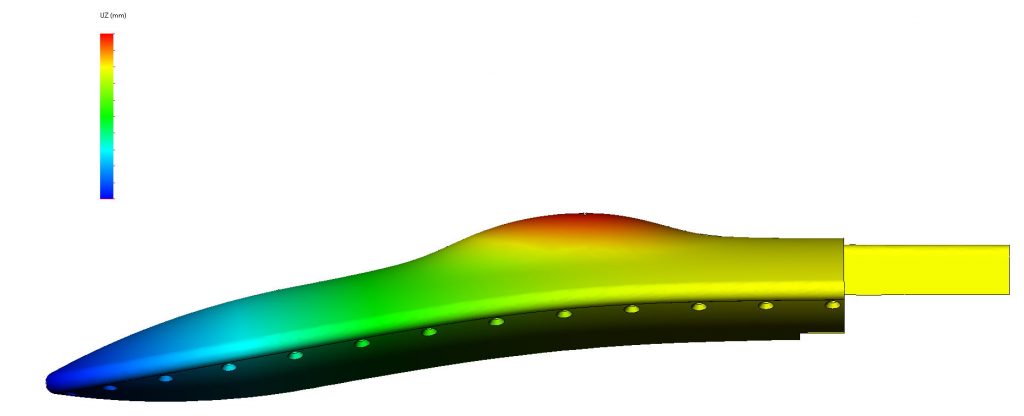
The image below is the predicted FEA thermal-structural interaction of the test article showing the result of curved panel heating and resultant z-axis model distortion where red is in a positive direction and blue a negative direction. As is common with FEA deflection displays, the distortions are exaggerated.
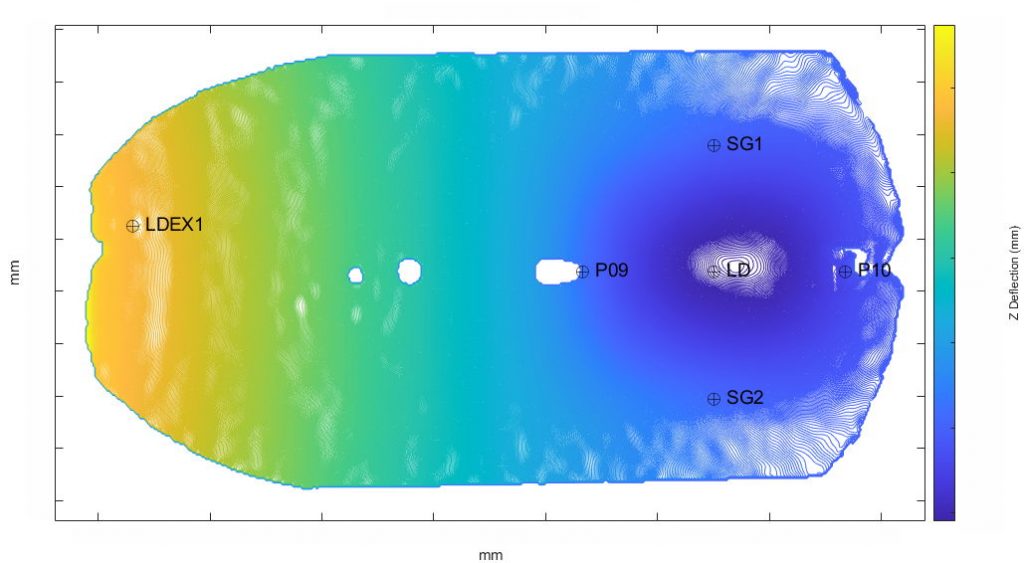
The figure below is a colormap from 3D-DIC data from a Mach 4 wind tunnel test showing actual test article deflections at the point of peak panel heating. Here the colors are somewhat reversed, i.e., blue showing positive z-axis deflections and orange showing negative deflections.
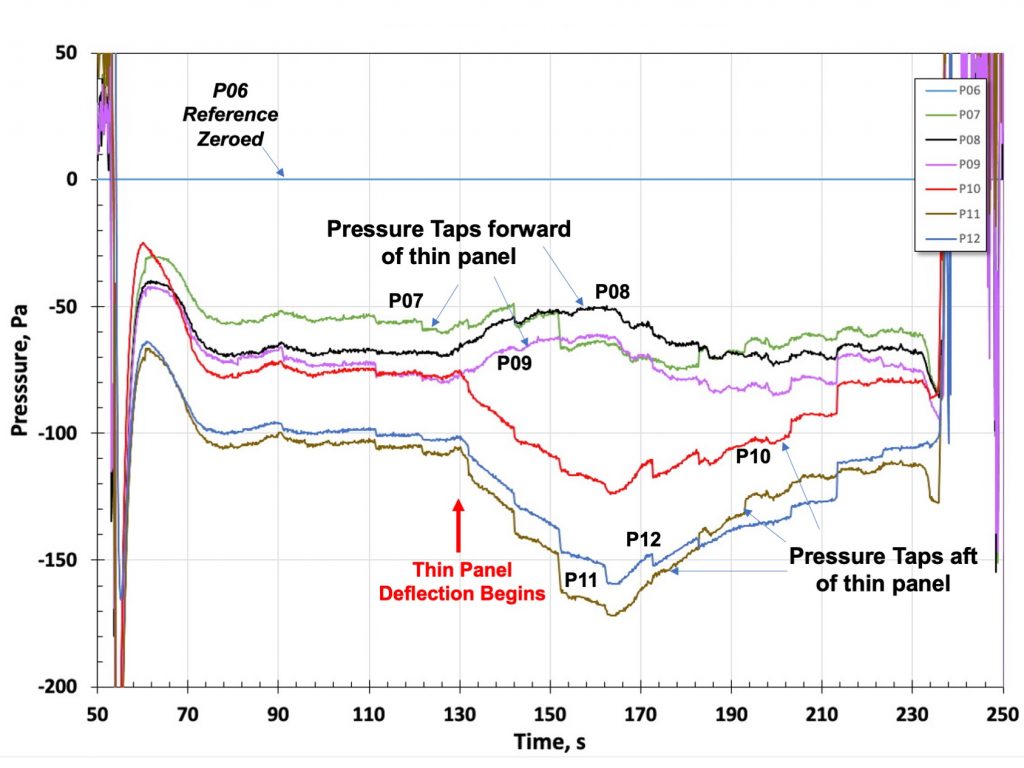
The chart below is an example of pressure data at Mach 5 near the thin, curved panel illustrating the surface pressure signature of the deflection of the panel due to heating.
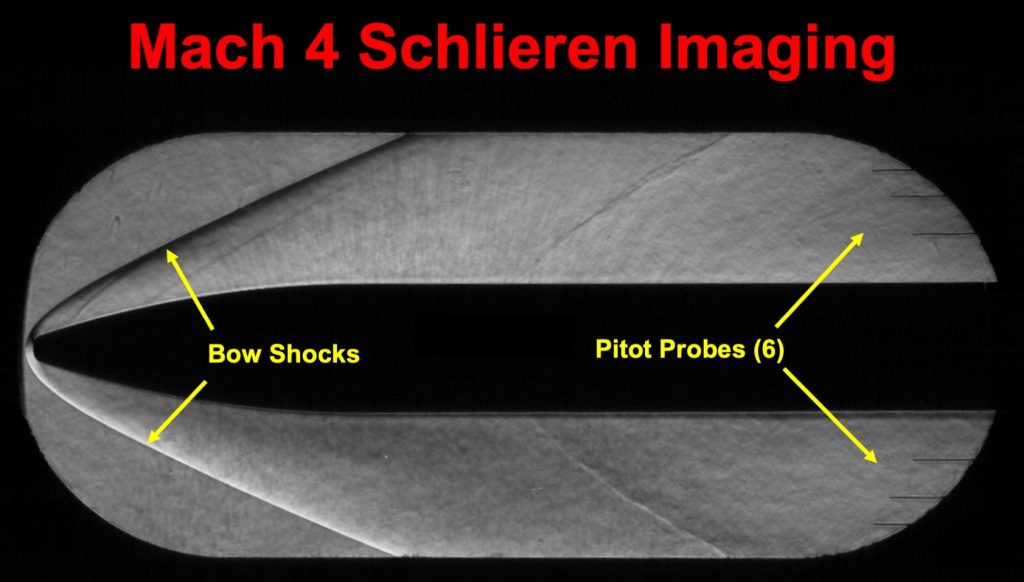
Finally, the photo below is a frame from the schlieren high-speed imaging video showing the characteristics of the shock environment at Mach 4. If you look closely, you can see the individual Mach cones of each of the pitot probes.
This Phase II work was sponsored by the AFRL under SBIR Program contract FA8651-17-C-0071.